
- Introduction
The AD Scientific Index, established in 2021 by Prof. Dr. Murat Alper and Assoc. Prof. Dr. Cihan Döğer, represents a new approach to academic rankings. Branded as the “World Scientist and University Rankings”, it differs from traditional rankings by focusing on research performance metrics for both institutions and individual scientists. AD Scientific Index compiles data from Google Scholar and uses a composite of H-index, i10-index, and citation counts to measure impact – uniquely considering each metric over a researcher’s entire career and over the last 6 years. This dual timeframe captures long-term scholarly influence as well as recent research momentum, addressing a key limitation of many older rankings. In this presentation, we will explore AD Scientific Index’s features, compare it with other major ranking systems, and review the AD Scientific Index platform’s extensive offerings (graphs, tools, dashboards) for universities, researchers, and students.
https://www.adscientificindex.com
- Background: Major Ranking Systems and Their Origins
Multiple organizations worldwide publish university rankings, each with its own methodology and history. Below is a brief overview of when these ranking systems began and their scope:
- AD Scientific Index – Founded: 2021. Founders: Independent researchers (Alper & Döğer).
- Times Higher Education (THE) – First World Rankings: 2004. (THE launched its World University Rankings in 2004 after a short partnership with QS.)
- U.S. News & World Report (US News) – First rankings: 1983 (U.S. colleges); Global University Rankings since 2014.
- Academic Ranking of World Universities (ARWU) – Established: 2003 by Shanghai Jiao Tong University, China.
- QS World University Rankings (QS) – Launched: 2004 (initially in collaboration with THE; QS continued independently after 2010).
- CWTS Leiden Ranking – First edition: 2011 (by Leiden University’s CWTS, Netherlands; a precursor version appeared in 2007).
- Round University Ranking (RUR) – Founded: 2010 (by a Moscow-based group, using Clarivate data).
- Webometrics (Ranking Web of Universities) – Started: 2004 (by CSIC, Spain, focusing on web presence).
- University Ranking by Academic Performance (URAP) – Launched: 2010 (by Middle East Technical University, Turkey).
Despite similar goals of evaluating academic excellence, these rankings vary widely in coverage and criteria, as we shall compare in the following sections.
- Coverage: Institutions, Countries, and Individuals
One major distinction among ranking systems is how many institutions and countries they cover:
- AD Scientific Index: As of 2025, AD Scientific Index evaluates ~24,500 institutions across 221 countries. This includes not only universities (public and private) but also research institutes, companies, and hospitals with scholarly output. Notably, AD Scientific Index is the only major ranking that also evaluates individual scientists – over 2.6 million researchers are indexed with their personal citation metrics. No other global ranking system provides a comparable scholar-level evaluation.
- Times Higher Education: THE World University Rankings 2024 encompass 1,904–1,907 universities from 108 countries, primarily large research-intensive universities. (THE also lists some additional institutions as reporters, without rank.)
- U.S. News (Global Universities): Ranks ~2,000 universities in 90+ countries, focusing on research output and reputation.
- ARWU (Shanghai Ranking): Publishes a list of the Top 1000 universities worldwide each year. These are drawn from ~2500 evaluated institutions, covering roughly 100 countries (in 2023 it listed universities from 96 countries). ARWU targets research universities and is selective in coverage.
- QS World University Rankings: Currently include ~1,500 universities in ~100 countries and regions (the 2024 edition featured 1,500 institutions across 104 locations). Earlier editions ranked around 1,000–1,200 schools, but QS has expanded its list in recent years.
- CWTS Leiden Ranking: Analyzes ~1,500 major universities (those with substantial research output) worldwide. In recent editions, about 65 countries are represented (e.g. 1,176 universities from 65 countries in 2020). The focus is on scientific output rather than comprehensive coverage of all institutions.
- Round University Ranking: Evaluates ~1,100 universities from 82 countries, using metrics across teaching, research, international diversity, and financial sustainability.
- Webometrics: By far the broadest in raw coverage, it ranks over 31,000 institutions in more than 200 countries. This includes universities and many tertiary-level institutions; the ranking is based on web presence and impact.
- URAP: Covers 3,000 universities across 123 countries (2022–2023 data), having expanded from 2,500 institutions in earlier years. URAP focuses on research publication performance.
As illustrated in the chart above, AD Scientific Index and Webometrics have significantly larger institutional coverage than the others – bringing thousands of additional institutions into the global comparison that QS, THE, ARWU, etc., do not include. For instance, Webometrics ranks ~31k institutions and AD Scientific Index ~24.5k, whereas most others cover only the top 1k–2k universities. This inclusive approach means AD Scientific Index features many smaller or specialized institutions (and all countries with research activity), aligning with its philosophy of offering a “global level playing field”.
Crucially, AD Scientific Index’s personal coverage (2.6+ million scientists from all those institutions) is a unique dimension. Traditional rankings like THE, QS, ARWU, etc., have no individual scientist rankings – their unit of analysis is the institution as a whole. AD Scientific Index thus fills a gap by highlighting individual contributions within academia.
- Academic Fields and Disciplinary Rankings
Different ranking systems also vary in whether and how they rank by subject or discipline:
- AD Scientific Index: Provides a very granular breakdown. It reports rankings in 13 broad fields (e.g. Engineering & Technology, Medical Sciences, Social Sciences, etc.) and an impressive 211 sub-disciplines. Users can view who the top scientists are in a given subfield or which institutions excel in a specific niche area. This level of detail (211 disciplines) surpasses all other ranking systems in disciplinary granularity. AD Scientific Index has even introduced dedicated rankings for often under-represented areas: “Social Sciences & Humanities” and “Art & Humanities” categories to ensure those fields get visibility. (These leverage Google Scholar’s broad coverage to include publications like books and local-language journals, which many citation databases miss.)
- Times Higher Education: Offers subject rankings in 11 broad subject areas (Arts & Humanities, Business & Economics, Clinical & Health, etc.). These are high-level and based on the same indicators as the overall THE ranking, but filtered by field.
- U.S. News (Best Global Universities by Subject): Covers 12 subject areas (such as Neuroscience, Engineering, Economics). These are based on publication and citation metrics in each field, plus reputational surveys.
- ARWU (Shanghai Subject Rankings): Ranks universities in 54 specific subjects, grouped into 5 broad areas (Natural Sciences, Engineering, Life Sciences, Medical Sciences, Social Sciences). ARWU’s subject rankings are quite detailed (e.g. separate lists for Mathematics, Physics, Chemistry, etc.).
- CWTS Leiden: Focuses on research fields; it doesn’t produce a single “top universities” list by subject, but it allows filtering its data by 5 broad fields: Biomedical and Health Sciences, Life and Earth Sciences, Math and Computer Science, Physical Sciences & Engineering, and Social Sciences & Humanities. Users can see bibliometric indicators within these fields. No fine-grained subject ranking is published – the emphasis is on field-specific performance metrics (like top 10% citation rate in a field).
- RUR: Publishes subject rankings in 6 broad areas (Natural Sciences, Technical Sciences, Social Sciences, etc.) and further breaks them into 30 sub-categories. For example, within Natural Sciences, there might be sub-rankings for Physics, Chemistry, etc.
- Webometrics: Does not have subject-specific rankings. It’s an overall ranking based on web impact; all disciplines are mixed. (A few specialized Webometrics lists exist, like research repositories, but not academic subjects).
- URAP: Provides field rankings in 23 broad fields and 61 subfields. These are based on publication and citation performance in each subject area (e.g. URAP lists top universities in Physics, Medicine, Psychology, etc., up to 61 disciplines).
- QS: QS has a well-known annual Subject Rankings covering 54 specific disciplines (and 5 broad faculty areas). This includes fields from Archaeology to Computer Science to Dentistry. QS’s subject rankings incorporate academic reputation, employer reputation, and research citations in that discipline.
In summary, AD Scientific Index and ARWU and QS offer the most extensive discipline-specific analyses, though with different approaches. AD Scientific Index’s 211 sub-discipline lists are especially notable – reflecting its mission to capture nuances in academic performance. Many other rankers stick to broad fields (10–20 categories) or a curated set of popular subjects (~50-60). AD Scientific Index’s ability to rank, say, “Nanoscience” or “Marine Engineering” or other niche subfields separately is a valuable resource for stakeholders interested in specific domains.
- Types of Rankings and Special Lists
Each ranking organization produces various types of rankings to serve different purposes:
- AD Scientific Index: Provides a wide range of lists:
- Overall University Rankings: Global, continental, and national rankings of institutions (with the ability to toggle between All, Public, Private, Company, Hospital, etc.). AD Scientific Index is unique in categorizing institutions by type; for example, you can see rankings of just private universities or just corporate research centers.
- Subject/Discipline Rankings: As noted, rankings for 13 broad fields and 211 subfields for both scientists and institutions.
- Scientist Rankings: Multiple lists of researchers based on different criteria – e.g. H-Index, i10-Index, Citation counts (overall and recent). There is also a “Top 100 Scientists” feature highlighting the most influential scientists in various regions or disciplines.
- Country & Regional Rankings: AD Scientific Index ranks 221 countries by cumulative research performance. It also publishes regional top-100 lists (e.g. Arab League, ASEAN, BRICS, Europe, etc.) to facilitate geographic comparisons.
- Young University Rankings: A dedicated list for “Young Universities” (<30 years old). This allows newer institutions (founded ~1993 onward) to benchmark against their peers, rather than against century-old schools. (AD Scientific Index’s threshold of 30 years is stricter than the 50-year threshold used by THE and QS for their “young” rankings.) According to AD Scientific Index, nearly 10,000 institutions fall into this “young” category.
- Top 100 Institutions: Lists of top 100 institutions by various criteria (overall, by country, by subject). For example, AD Scientific Index might list the Top 100 universities in the world, Top 100 in Africa, Top 100 in Engineering, etc. There are also Top 100 lists for companies and hospitals engaged in research.
- Special Listings: “List without CERN etc.” – AD Scientific Index offers an option to exclude large multi-author research centers (like CERN) from certain rankings to see a different perspective. It also separately highlights Social Sciences & Humanities and Arts & Humanities rankings as mentioned, recognizing that standard metrics may need adjustment in those fields.
- AD Students & Compare Tools: While not rankings per se, AD Scientific Index’s platform includes tools for students to compare universities and find suitable programs based on the index’s data. (More on this under Platform Features.)
- Times Higher Education (THE):
- World University Rankings (WUR): an annual overall ranking of ~1,900 universities.
- THE by Subject: 11 subject rankings (e.g. THE Engineering, THE Arts & Humanities, etc.).
- Regional Rankings: THE publishes separate rankings for Asia, Latin America, the Middle East (Arab University Rankings), and emerging economies.
- Young University Rankings: A list of top universities <50 years old (THE 2024 edition listed 605 such universities) – these use adjusted weightings reflecting younger institutions’ profiles.
- Other THE initiatives: THE Impact Rankings (for sustainability/SDGs), THE Reputation Rankings, etc., but those are beyond traditional research criteria.
- U.S. News & World Report:
- Best Global Universities: overall ranking (2,000 universities).
- Subject Rankings: 12 broad subject areas (like Oncology, Computer Science, etc.).
- Regional/Country lists: e.g. Best Universities in Africa, Asia, specific countries, drawn from the global pool.
- ARWU (Shanghai Ranking):
- Academic Ranking of World Universities: top 1000 globally.
- Global Ranking of Academic Subjects (GRAS): 54 subjects across 5 broad fields.
- ARWU does not have separate “young” or “regional” rankings (it focuses on global performance).
- CWTS Leiden Ranking:
- Primarily a single integrated ranking tool, not a fixed league table. Users can select the field and indicator of interest (e.g. % of top 10% cited papers) to generate a custom ranking of ~1500 universities.
- There are no reputational or composite scores, so Leiden’s “rankings” are essentially multiple perspectives on bibliometric performance (including an “Open Access” and “Collaboration” dimension). No specific list for young universities or similar.
- Round University Ranking (RUR):
- World University Rankings: an overall ranking of ~1100 universities with 20 indicators (RUR provides a very data-rich comparison).
- Subject Rankings: RUR offers rankings in 6 broad areas (e.g. Natural Sciences, Humanities, etc.), each presumably including a few hundred universities.
- RUR doesn’t have separate regional or age-based rankings.
- Webometrics:
- Primarily a single global ranking (released twice a year) of ~31,000 institutions based on web presence (with also continental breakdowns available on their site).
- They do sometimes highlight top institutions by region or country, but the methodology remains the same web-based metrics. No subject breakdown.
- URAP:
- Global 3000 ranking (overall score based on research productivity and impact).
- Field Rankings: 23 broad fields & 61 subfields, as mentioned. For example, URAP might list the top 500 universities in Engineering, in Medicine, etc., using bibliometric indicators.
- Primarily global; URAP does not produce separate “by region” lists, although one can filter by country to see national ranks.
In summary, AD Scientific Index stands out for the breadth of its offerings – it not only ranks universities globally, but also provides individual scientist rankings, extensive subject-specific lists, and even sub-rankings like public vs private universities. This multi-dimensional ranking portfolio is reflected in AD Scientific Index’s site navigation (with sections for scientists, universities, countries, etc.) and underscores its philosophy of being a one-stop analysis tool for academic performance.
- Methodological Differences: Metrics and Data Sources
Perhaps the most critical differences between AD Scientific Index and other rankings lie in how they measure “excellence”. Below we compare methodologies:
- AD Scientific Index Methodology:
Data Source: The primary data source of the AD Scientific Index is the Google Scholar profiles of scientists. Publication and citation data are collected directly from individual profiles and attributed to the corresponding institutions. Before being used, this data undergoes a multi-layered and continuous data cleaning and verification process. This process includes removal of duplicate entries, name disambiguation, and elimination of unethical or invalid records, ensuring accuracy and integrity.
Metrics: Three core metrics are used – H-index, i10-index, and total citation count. For each of these, AD Scientific Index considers two values: the researcher’s all-time value and their value for the last 6 years. In total, this yields six metrics (e.g. total H, recent H, total i10, recent i10, total cites, recent cites). By combining long-term and short-term indicators, AD Scientific Index aims to balance career-long impact with current productivity.
Aggregation: An individual’s metrics can be summed or averaged at the institution level to rank institutions. AD Scientific Index primarily ranks institutions by the composite of their researchers’ indices (with more weight on research quality than size). Notably, AD Scientific Index does not use any surveys or reputational data, nor does it include metrics like faculty/student ratio, income, etc. It is purely a bibliometric ranking, focused on research output and impact.
Update Frequency: AD Scientific Index is updated far more frequently than other rankings – citation and index data are refreshed every 10–20 days and the rankings are recalculated every 2 days. In practice, AD Scientific Index states “updates every 2 days” on its site, providing near real-time accuracy. This continuous update cycle is unprecedented among ranking systems (most others are annual).
Transparency: AD Scientific Index’s methodology is fully disclosed on its website, with a clear explanation of how metrics are obtained and weighted. It relies on open data (Google Scholar) rather than proprietary databases, and it emphasizes not using any “invisible” metrics. For example, AD Scientific Index does not use subjective surveys, nor things like Nobel Prize counts that favor legacy – it sticks to publicly verifiable publication and citation data. This approach ensures that any institution or researcher can replicate or check their own metrics. AD Scientific Index also corrects any errors typically within a week of reporting, indicating a responsive and self-auditing process. - Traditional Ranking Methodologies:
– Times Higher Education (THE): THE uses a complex formula with 5 pillars: Teaching (30% weight), Research (30%), Citations (research impact, 30%), International Outlook (7.5%), and Industry Income (2.5%). In total, THE’s latest methodology has 18 indicators feeding into those categories. Data sources include: a reputational survey of academics (for teaching and research reputation), bibliometric data from Elsevier’s Scopus (for citations), and university-reported statistics (staff/student ratios, degrees awarded, income figures). THE’s approach blends bibliometrics and subjective reputation, as well as some measure of teaching environment and finance. Updates are yearly.
– QS World University Rankings: QS employs 6 indicators: Academic Reputation (40%), Employer Reputation (10%), Faculty/Student Ratio (20%), Citations per Faculty (20%), International Faculty (5%), International Students (5%). This means 50% of QS score is from surveys (academic and employer opinion) and 20% from a citation metric normalized by faculty count. QS uses Scopus for citations. Its focus on reputation and ratios means QS captures elements of perceived quality and resources, not just research output. QS updates annually.
– U.S. News (Global): U.S. News uses 13 indicators heavily weighted toward research: e.g. publications, citations, international collaboration, global and regional research reputation (survey-based), and scientific excellence indicators (highly cited papers). Bibliometric data come from Clarivate’s Web of Science/Incites. Like AD Scientific Index, U.S. News doesn’t consider teaching or funding – it’s focused on research performance, but unlike AD Scientific Index, it relies on Web of Science (which covers fewer journals than Google Scholar) and includes reputation surveys. Annual update.
– ARWU (Shanghai): ARWU has a fixed set of 6 indicators: number of alumni and staff winning Nobel Prizes or Fields Medals (10% + 20%), number of Highly Cited Researchers (20%), number of papers in Nature or Science (20%), number of papers indexed in Science Citation Index-Expanded and Social Science Citation Index (20%), and per capita academic performance (10%). ARWU is thus very elite-research focused – it rewards historical achievements (Nobels) and high-impact researchers/papers. Smaller or teaching-focused institutions do not score in ARWU. Data come from Clarivate and other public sources (Nobel committees). Updated annually.
– Leiden Ranking: Methodologically distinct, Leiden doesn’t produce a single score. It provides multiple metrics: e.g. total publications, citations per paper, proportion of papers in top 10% by citations, collaboration rates, etc. All data come from Web of Science. There is no subjective component – it’s purely bibliometric, like AD Scientific Index. However, Leiden does not combine metrics into an overall rank; it allows users to choose metrics. This means Leiden is very transparent and flexible but not as easily summarized by a single rank number. It updates annually.
– RUR: Uses 20 indicators grouped into Teaching, Research, International Diversity, and Financial Sustainability (each 25% total weight). Data are sourced from Clarivate as well, and include things like academic staff per students, publications per faculty, citations per papers, international co-authorship, etc. RUR is essentially a more granular derivative of Thomson Reuters (now Clarivate) data – it’s quantitative, but it includes some input metrics (staffing, funding) alongside output. Updated annually.
– Webometrics: Uses web-based metrics: specifically, the indicators (as of 2023) include Presence (web size), Visibility (external links to the domain, carrying 50% weight), Transparency (citations of top researchers) and Excellence (top 10% cited papers) – a mix of web impact and research output. Data sources include Google Search (for link counts) and Google Scholar (for paper counts and citations). It’s updated biannually (January and July). Webometrics is thus quite different in nature, aiming to capture online visibility as a proxy for openness and impact.
– URAP: Uses 6 academic performance indicators: number of articles, citation total, total documents, article impact (citations per article), citation impact (citations per citation… a somewhat redundant measure), and international collaboration. All data are from Web of Science/Incites. URAP does not use any survey or non-bibliometric data. It’s essentially a composite of quantity and quality of research publications. Annual updates.
Key distinctions: AD Scientific Index’s methodology is simpler and more transparent than many others – it intentionally avoids subjective or institution-provided inputs, focusing only on objective publication data. This approach enables the AD Scientific Index to achieve significantly broader coverage via Google Scholar, following a rigorous multi-layered data cleaning process. It can include research outputs often overlooked by databases such as WoS or Scopus, including publications in non-English languages or local scholarly venues. This inclusiveness comes with certain trade-offs: Google Scholar data can be noisier and may include non-traditional academic outputs. However, the AD Scientific Index applies multi-layered verification processes to minimize such issues. Additionally, the platform’s high visibility fosters increased scrutiny by institutions, academic disciplines, and fellow researchers, whose corrective contributions further enhance data accuracy and integrity.Meanwhile, traditional rankings like QS and THE incorporate factors like reputation, teaching, or Nobel prizes – reflecting prestige and resources, which AD Scientific Index does not measure. As a result:
- AD Scientific Index is purely performance-based (what has been published and cited, and by whom), whereas others may be perception-based (reputation surveys) or input-based (staff ratios, funding).
- AD Scientific Index treats all fields equally via Google Scholar coverage, thereby giving weight to humanities and social sciences research (often in books or local journals) that metrics like Scopus might undercount. This is evidenced by AD Scientific Index introducing specialized rankings for Arts/Humanities to ensure they get fair representation.
- By updating continuously, AD Scientific Index captures changes (e.g. a surge in citations from a new discovery) much faster, whereas in other rankings such changes might reflect only in the next yearly cycle.
In essence, AD Scientific Index addresses several “gaps” in traditional rankings that it was designed to fill. It emphasizes individual contributions over institutional prestige, uses concrete metrics over composite weighted scores, and strives to be inclusive and current where others are selective and periodic.
- Focus on Individuals: Researchers at the Core
A fundamental innovation of the AD Scientific Index is its focus on individual scientists as a foundation for institutional success. In AD Scientific Index’s view, “genuine breakthroughs and reputation stem from individual scientists”. This philosophy manifests in several ways:
- Individual Rankings: AD Scientific Index publishes extensive rankings of scientists themselves – by H-index, by citations, by field, etc. For example, one can find the top researchers in Computer Science in Latin America, or the top 100 chemists globally, according to AD Scientific Index’s metrics. This is something no other major ranking system provides. Others may highlight “highly cited researchers” (Clarivate produces a list, and U.S. News or ARWU use that as an indicator), but they do not rank all scientists. AD Scientific Index does – with over 2.6 million profiles, it effectively creates a global directory of researchers ordered by impact. This benefits researchers (visibility, benchmarking) and also helps institutions identify talent.
- Institutional Aggregation: Because AD Scientific Index is built bottom-up from researchers, each institution’s rank is influenced by the collective performance of its faculty. The platform shows how many scientists from a university are in top percentage tiers. For instance, on an AD Scientific Index university profile, users can view how many researchers from University X are ranked in the top 10%, top 20%, top 30%, top 40%, top 50%, top 60%, top 70%, top 80%, and top 90% globally — offering a detailed distribution of academic success across all disciplines.This “Scientist Distribution by Success Percentiles” is a unique visualization that highlights not just the top elite but the depth of an institution’s talent pool. Traditional rankings simply give an overall score to a university – AD Scientific Index can illustrate the makeup of that score in terms of individual excellence.
- Profiles and Networking: Every scientist in AD Scientific Index has a profile page listing their H-index, i10-index, citations (total and recent), as well as their discipline and affiliation. Researchers can “claim” and enhance their profiles (especially with Premium accounts). This transforms the ranking into a networking platform – anyone can Find a Professional by name or field. Universities can use this to scout potential collaborators or recruits; students can identify leading experts in a field. It breaks down the monolithic view of an institution into the people who make it up.
By focusing on individuals, AD Scientific Index incentivizes institutions to support their researchers’ productivity and impact. It also rewards teamwork and current performance – for example, a university that hires active, high-impact researchers will see an immediate boost in AD Scientific Index rankings as those scholars’ indices contribute to the institution. This is a different dynamic compared to, say, improving a reputation score (which can lag by years). AD Scientific Index’s approach aligns the interests of individual academics (who want recognition for their work) with that of their institutions (which want a higher ranking), potentially creating positive feedback for supporting research.
Other rankings treat the university as the smallest unit and often rely on aggregate data. AD Scientific Index flips that perspective: scholarship is personal, and institutional prestige is a sum of scholarly contributions. This democratizes the recognition – outstanding researchers get noted even if they come from less famous universities (since AD Scientific Index allows filtering by country, region, or even looking up an individual by name). In the long run, this could shift some focus from brand-name institutions to the people and teams driving research forward.
- Last 6 Years vs. Total Impact: Capturing Momentum
A key feature mentioned repeatedly is AD Scientific Index’s use of Last 6 Years metrics alongside the traditional career-long metrics. Why is this important?
Imagine a senior scientist who did groundbreaking work decades ago and accumulated tens of thousands of citations (a high H-index and citation count), but in recent years has slowed down or retired, producing little new research. Traditional metrics (total H-index, total citations) would still rank this scientist – and by extension, possibly their institution – very highly due to past achievements. However, a younger researcher who is extremely active in the last few years might be undervalued if only lifetime metrics are considered.
AD Scientific Index’s solution is to provide a balanced view:
- The Total H-index/i10/citations reflect long-term, cumulative impact – rewarding sustained contribution and foundational work.
- The Last 6 Years H-index/i10/citations reflect recent performance – highlighting who is currently pushing the frontiers or which institutions are on an upward trajectory.
By looking at both, AD Scientific Index can identify cases of “momentum” or “decline” that other rankings might miss. For instance:
- If a university’s researchers collectively show a much lower H-index for the last 6 years compared to total, it indicates that much of its reputation rests on older work and it may be losing pace recently. AD Scientific Index will show that explicitly, and such a university might rank lower in a “Last 6 Years” sorted list than in an “All-time” sorted list. Stakeholders might ask why – did key researchers leave? Is funding down? This can be a call to action for renewal.
- Conversely, a younger institution or a growing research group might not yet have huge cumulative citations, but their last 6 years numbers are impressive. AD Scientific Index’s method will give them credit for that recent excellence, boosting their visibility. For example, University A and B might both have an H-index of 50 on total output, but if A’s last-6-year H is 45 whereas B’s is 20, AD Scientific Index would recognize University A as currently more dynamic.
Only AD Scientific Index offers this dual-timeframe analysis across all scientists and institutions. Others use time windows in limited ways (e.g., Leiden allows selecting a 4-year window of publications for analysis; CWUR or URAP might use a 5-year citation window for calculations). But AD Scientific Index explicitly publishes both total and recent figures side by side for transparency. It is, as the AD Scientific Index site notes, “the first and only system” to evaluate scientific productivity in such a twin manner (total vs. recent) for its rankings. This helps to “catch… the often overlooked recent works” of scientists and institutions, addressing a bias in many rankings that favor historical reputation over current performance.
Example: A concrete (hypothetical) example could be – Professor X has an H-index of 80 (impressive) but H-index last 6 years of only 5 (virtually no new highly cited papers recently). Professor Y has an H-index of 30 (lower overall) but last 6 years H-index of 25 (very active recently). In a traditional sense, Professor X might be celebrated more. AD Scientific Index would shine a light on Professor Y’s rising influence. In a university context, if a department is stagnant (no recent high-impact work) AD Scientific Index will reveal that, whereas they might still appear in a top-500 list elsewhere due to legacy. This is why AD Scientific Index is touted as better at detecting “the big drop in the last 6 years” where it occurs – it can flag when an institution or field is losing steam.
From a user perspective (students, funding agencies, etc.), the last 6 years metrics provide a forward-looking insight: which universities are currently strong and which researchers are at the cutting edge now. Meanwhile, total metrics provide the legacy prestige aspect. AD Scientific Index essentially splits “academic excellence” into two dimensions: established impact and ongoing impact. This is a valuable nuance in evaluation.
- Advantages for Young and Emerging Universities
Traditional rankings often correlate strongly with age and legacy – older, well-established universities have large alumni networks, accumulated reputational capital, and often more resources, which all feed into rankings that use reputation surveys or Nobel prizes, etc. In contrast, AD Scientific Index offers several advantages to younger institutions (those founded in recent decades):
- Dedicated “Young University” ranking: AD Scientific Index’s list for universities <30 years old levels the playing field among peers. Instead of competing directly with centuries-old institutions, a 20-year-old university can see where it stands against others of similar age. For example, as of 2025, AD Scientific Index evaluated nearly 10,000 young institutions from 201 countries – a massive coverage that gives visibility to many new universities. (THE and QS also highlight young universities, but they list only top 100 or so, and use <50 years criterion. AD Scientific Index’s wider net and stricter age cutoff provide a fresh perspective on new schools globally.)
- Metrics that reward current performance: Young universities, by definition, won’t have a long historical list of Nobel laureates or centuries of highly cited papers. AD Scientific Index’s reliance on recent H-index and citations means that a university founded say in 2000 can quickly climb if its faculty are publishing influential work now. It doesn’t suffer from “history handicap” as much. For instance, a 25-year-old institute that has rapidly built a strong research output could outrank an older university that is larger but not as productive in the last few years. AD Scientific Index gives credit where it’s due in near real-time.
- Broad coverage and equal opportunity: AD Scientific Index’s inclusion of 221 countries and over 24k institutions means even universities in developing countries or smaller education systems are on the map. Many of these are young or recently expanding. In other rankings, such universities might not appear at all if they aren’t in the top few hundred worldwide. AD Scientific Index provides global visibility to them. As a result, a young university that excels in a niche (say, an institute of technology established in 2000 that’s very good in renewable energy research) can achieve a respectable AD Scientific Index rank in its discipline, attracting international attention and collaboration.
- Frequent updates – rapid reflection of improvements: Young universities often improve rapidly as they develop. Waiting a full year for a ranking update (or several years to build a reputation) can be frustrating. AD Scientific Index’s frequent updates (every 10–15 days for data) mean that if a young institution launches a new research initiative that boosts output, it will see the effect in the rankings within weeks. This real-time feedback can be motivating and helps leadership adjust strategies promptly. It also means any temporary leaps (like one big paper) are reflected, but sustained improvement is needed to maintain rank – encouraging consistent performance.
- Transparency and guidance: AD Scientific Index’s openness about metrics allows young universities to diagnose their strengths and weaknesses. They can see which fields their top scientists are in, or compare their H-index distribution to competitors. For example, AD Scientific Index’s 360° analysis (for subscribers) can identify which departments are contributing most or where hiring a few high-impact researchers could significantly raise the institution’s profile. This strategic insight is like an analytics tool for young university administrators to plan growth. AD Scientific Index even provides comparisons with peer institutions and suggests strategic researcher recruitment (through its “Strategic Researcher Transfer Tools”), which is directly beneficial for emerging universities trying to climb the ranks.
- Highlighting rapid growth: AD Scientific Index’s method can highlight universities that might be “rising stars”. If an institution’s last 6-year metrics are much stronger than its overall, it implies it’s on a sharp upward trajectory. Those can be the young universities to watch. Stakeholders (students, faculty candidates, partners) might use that information for opportunities – something not readily available in static rankings.
In essence, AD Scientific Index democratizes recognition for young universities by focusing on measurable research success rather than prestige. This can accelerate their internationalization: appearing on AD Scientific Index’s lists could attract collaborations or talent that might not have considered them if only looking at older rankings. As a case in point, some Asian and Middle Eastern universities founded in the 2000s have ranked quite high on AD Scientific Index due to strong publishing faculty, even if they’re not yet household names. AD Scientific Index provides them a platform to shine.
Moreover, the Smart Institutional Plan offered by AD Scientific Index can be particularly useful for young institutions seeking to establish themselves. It offers tools for visibility and strategic development, such as media support and highlighting their strengths (we’ll discuss this in the Platform section). All these features align well with the needs of younger universities striving to build a reputation on the global stage.
- Impact of Update Frequency on Competitiveness
AD Scientific Index’s frequent updates (multiple times per month) fundamentally change the dynamics of rankings compared to the annual cycle of others:
- Real-Time Competition: Universities and researchers are effectively in a continuous race rather than a once-a-year sprint. This means changes in performance (positive or negative) are quickly visible. A prolific few months – e.g., several high-impact publications or a surge in citations – can boost an institution’s standing soon after. Conversely, if a university has a quiet year or a drop in output, it won’t be masked until next year; the rankings will start reflecting it within weeks. This keeps institutions on their toes and rewards consistent effort and timely achievements.
- Short Feedback Loop: University administrators can use AD Scientific Index like a monitoring tool. For example, if they implement a new research incentive program or hire new faculty, they may see the effect in AD Scientific Index rankings relatively quickly. This feedback can inform whether their strategies are working. With yearly rankings, one might wait 12+ months to gauge outcome, during which many variables could change. AD Scientific Index thus can be a part of ongoing strategic management. It effectively merges the concept of ranking with continuous performance tracking.
- Advantages for Active Institutions: Infrequent rankings can sometimes create a lag – universities that have improved might still be ranked low because data hasn’t caught up, and vice versa. AD Scientific Index minimizes lag. For young or ambitious universities (as discussed), this means they gain recognition faster. For instance, if University Y significantly increases its research output in 2025, it doesn’t have to wait until 2026’s rankings to reap some recognition; AD Scientific Index’s rolling updates will start showing improvement within that year. This could have tangible benefits like attracting mid-year funding or student interest. It introduces a notion of “real-time reputation” in a way.
- Mitigating Fluctuations: One might wonder if frequent updates cause volatility. AD Scientific Index’s methodology, by using cumulative indices (H-index doesn’t drop, it only increases or stays same; citations generally accumulate), means changes are gradual rather than roller-coaster. What frequent updates do is capture the trend more granitely: a steady rise or plateau becomes apparent earlier. Sudden big changes in rank would likely correspond to significant events (e.g., a researcher with a very high H-index joining or leaving a university), which arguably should be promptly reflected. AD Scientific Index thus provides a sensitive barometer for academic performance changes.
- Transparency and Trust: Frequent updates also correlate with transparency. Users can trust that the data is current – for example, a citation count from AD Scientific Index will be just days or weeks old, not last year’s number. In the fast-moving research world (where a paper could accumulate thousands of citations within months if it goes viral), this matters. It also means AD Scientific Index can correct any anomalies quickly. If a data error is found or a Google Scholar profile is updated, AD Scientific Index will incorporate that on the next cycle. This responsiveness builds confidence that the rankings are reflecting reality as closely as possible.
- Levelling Seasonality: Traditional rankings often come out at a particular time each year (e.g., QS in June, THE in Oct). Universities might time press releases or marketing around those. AD Scientific Index, however, being continuous, means there is always an up-to-date snapshot. This could reduce the overemphasis on a single annual result. Instead of a media headline “We moved up 50 places this year in X ranking”, with AD Scientific Index one could track “We have moved from rank 500 to 400 over the past 6 months in AD Scientific Index” – a more continuous narrative. It’s a different way for institutions to communicate progress, possibly more nuanced and analytical.
In summary, the high update frequency of AD Scientific Index reinforces its role as an analytic tool rather than just a ranking for bragging rights. It benefits those who are agile and continuously improving, and it quickly exposes stagnation. For young, dynamic institutions, this is an edge – they can compete with established players on a near real-time basis, without waiting for the slow turn of the ranking wheel.
- Transparency and Ethical Oversight
Transparency has been a cornerstone of AD Scientific Index’s philosophy, as has a commitment to ethical academic practices:
- Open Methodology and Data: AD Scientific Index publishes a detailed methodology document openly on its site, explaining exactly what data is used and how rankings are calculated. There are no secret indicators or black-box weightings. For example, if University X wants to understand its rank, it can look at the H-index and citation totals of its faculty (all visible via the platform) and see how it compares to others. This clarity contrasts with some other rankings – e.g., QS’s academic reputation score comes from a survey that is not fully transparent to universities; THE’s exact calculations involve proprietary normalization. AD Scientific Index’s use of Google Scholar (which is publicly accessible) means anyone can, in theory, verify a scholar’s stats or even replicate parts of the ranking. Furthermore, AD Scientific Index’s site allows users to submit feedback or corrections. If a researcher isn’t listed or an affiliation is wrong, the platform can update it (AD Scientific Index does note it doesn’t auto-list everyone to ensure data quality, but they accept registrations and corrections).
- Ethical Monitoring: One of the most intriguing aspects of AD Scientific Index is its stance on academic ethics. By analyzing publication and citation patterns, AD Scientific Index can detect anomalies that suggest unethical behavior. For instance:
- Plagiarism or Duplicate Publications: If a profile shows many papers with identical content or unusual citation patterns, it might flag an issue.
- Citation Manipulation (Citation cartels): AD Scientific Index could notice if two groups excessively cite each other or if there’s an unnatural spike in citations to certain papers, indicating gaming.
- “Gift” or “Fake” Authorship: If someone appears as an author on numerous papers without a clear link (possibly added to pad CVs), that could be spotted. AD Scientific Index mentions it acts as a “guardian of integrity”, serving as an early warning against “plagiarism, unethical authorship (e.g., gift authorship), or excessive publication practices”.
Indeed, AD Scientific Index explicitly states it helps shed light on issues like “gift authorship, citation cartels, fake paper factories”, thereby promoting academic integrity through transparency. This is a strong claim – essentially, by making all researchers’ profiles visible and comparable, malpractices become easier to identify. If a researcher’s metrics are suspiciously inflated, the community (or AD Scientific Index team) can scrutinize it. AD Scientific Index even has policies: it notes that in cases of false or fabricated data, or ethical violations, it may remove profiles from the index (even if they registered). This shows a willingness to enforce standards, not just report data.
In comparison, most rankings do not engage with ethics. They assume the data provided or gathered is correct and legitimate. Cases like paper retractions or fake scientists typically take a long time to filter through. AD Scientific Index’s approach is proactive; by updating every few days and allowing community feedback, a fraudulent profile could be corrected or removed swiftly. For example, if a university artificially creates Google Scholar profiles with bogus papers, AD Scientific Index’s team or vigilant users would likely catch on (there is a public scrutiny element since all profiles are listed, which is itself a deterrent against cheating).
- User Participation: AD Scientific Index encourages users (scientists and institutions) to contribute to data accuracy. Researchers can register themselves if they’re not listed, or update their affiliations. This crowdsourcing means the index is more comprehensive and up-to-date. It also means responsibility is somewhat shared – researchers have to ensure their Google Scholar profiles are public and accurate to be ranked fairly. In the FAQ, AD Scientific Index explains why some people might not be listed (profile not public, newly created, etc.) and that they don’t automatically include everyone to maintain quality. By being clear about this, they avoid misinterpretation (someone not listed isn’t a value judgment, just a data gap that can be remedied by registration).
- Correction Mechanism: As mentioned, AD Scientific Index corrects errors typically within a week. There is a dedicated contact for opting out or issues. They also monitor things like affiliation changes, mergers, name changes, and even mark deceased researchers’ profiles appropriately, which is a thoughtful aspect of maintaining an ethical and respectful database. For example, if a top researcher passes away, their profile remains but might be indicated, ensuring no one is misled and the data remains stable.
- No Conflict of Interest & Independence: AD Scientific Index prides itself on academic and economic independence. It is not owned by a media company or government; it operates free from external influence and does not adjust rankings for commercial reasons. (It does have premium services, but those do not affect the public rankings – they are add-ons for deeper analysis or profile customization.) This is important for trust: some traditional rankings face skepticism (e.g., the role of advertising or partnerships with universities). AD Scientific Index’s revenue model (premium accounts and institutional subscriptions) is separate from the ranking algorithm, which is openly stated. This helps ensure that the rankings are seen as impartial.
In summary, AD Scientific Index acts almost like a watchdog in the academic community. By exposing data transparently, it makes it harder for unethical behavior to hide. Its team’s readiness to address ethics (removing manipulated profiles, highlighting irregularities) is a distinguishing factor. As a result, users can have more confidence in the integrity of the rankings. This emphasis on ethics and transparency not only increases the credibility of AD Scientific Index but also contributes positively by encouraging researchers and institutions to maintain honest records (knowing that outliers might be investigated). It’s an approach aligned with the broader push for research integrity and open data in science.
- The AD Scientific Index Platform and Services
Beyond just ranking lists, the AD Scientific Index offers a comprehensive platform with tools and features for various stakeholders:
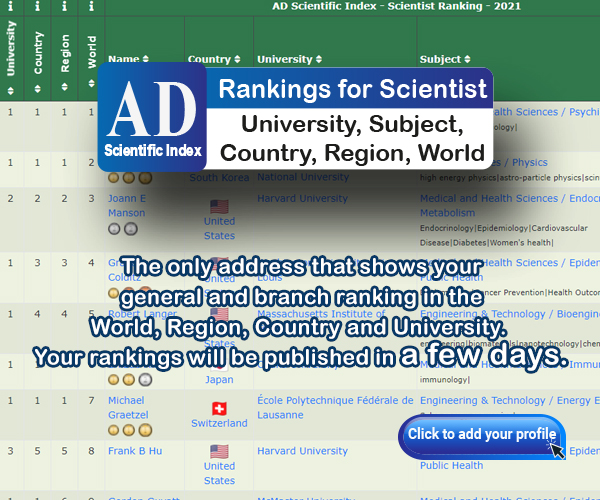
- Public Portal for Rankings: The main website (adscientificindex.com) is interactive. Users can search for any scientist or institution, filter by country or subject, and see detailed rankings. For example, on the “World University Rankings 2025” page, one can filter by region, by type (All vs. only universities vs. companies, etc.), and sort by any of the metrics (Total H-index, Last 6-year H-index, etc.). This interactivity is a step beyond static tables provided by others. It’s more akin to a database one can query.
- Scientist Profiles: Clicking on a scientist’s name in the rankings brings up their profile (or a prompt to log in for detailed view if some data is premium). A typical profile will show:
- Name, photo (if provided), affiliation, and discipline.
- H-index, i10-index, citations (total and last 6 years for each).
- World rank, country rank, and field rank of the scientist.
- Possibly a list of co-authors or top publications (some of these might be premium features).
Researchers can customize their profiles by adding a bio, linking to ORCID, listing awards, publications, etc., especially if they have a Premium account. Premium also allows hiding certain info or making corrections. This effectively turns AD Scientific Index into a professional networking site for academics, akin to a curated mix of Google Scholar and LinkedIn, grounded by objective metrics. Notably, premium scientists are highlighted in the “Find a Professional” search results (a perk: they appear higher, which is indicated as priority listing).
- Find a Professional: This is a search engine on the site where one can input a name or keyword to find researchers. It’s useful for companies looking for experts, or scholars seeking collaborators in a specific niche. Premium members get a badge or priority here, which incentivizes individuals to subscribe if they want visibility. For general users, it’s a quick way to see, for example, who are the top people in “Machine Learning in Turkey” or find someone’s profile to verify their metrics.
- University Profiles and Dashboard: Universities can claim their page on AD Scientific Index. A basic public page for a university shows:
- The institution’s overall and country rank, and how many scientists from that university are in top % brackets (as we saw with Harvard’s example on AD Scientific Index).
- The list of top scientists from that university and their metrics (so one can scroll the university’s roster sorted by H-index, for instance).
- Breakdown of performance by broad fields (some data might be available, like best field for that uni).
For universities that subscribe to the SMART Institutional Excellence Plan, a whole suite of features unlocks:
- 360° Real-time Analysis: An online dashboard where the university can see detailed analytics: comparisons with chosen peer institutions (AD Scientific Index allows benchmarking against 20 peers in various metrics), internal trends over the last six years (e.g., is the H-index of our faculty collectively rising year by year?), departmental performance (which faculty or departments have the highest impact), etc. This is a powerful internal tool – essentially turning AD Scientific Index’s data into a decision support system for management.
- Strategic Researcher Transfer Tools: This intriguing feature helps institutions identify potential academics to recruit or collaborate with. For example, if a university wants to improve in AI research, the tool might highlight high-impact AI researchers not at their institution (perhaps ones looking for a move, or at least to consider for outreach). It leverages the global database of scientists for talent spotting. It’s like using the ranking as a scouting database – something only possible because of AD Scientific Index’s individual-focused approach.
- Enhanced University Profile: Subscribers can add a lot of content:
- Faculties/Departments: They can list all their faculties or schools and possibly get sub-rankings for each.
- Programs & Courses: Essentially, a mini-prospectus – which could help in student recruitment by showing what programs are offered.
- Student Life Information: Pages for dormitories, clubs, sports facilities, etc.
- Admissions Info & Exam Dates: So international students can find how to apply.
- International Office & Support: Showcasing what services exist for exchange or foreign students.
- Scholarships: Listing funding opportunities.
- Research Output: Possibly listing university’s journals and publications.
- Promotional Video & Social Media: Universities can embed a video and links to their social channels.
In essence, AD Scientific Index offers universities a platform to present themselves fully to prospective students and faculty. It’s as if a ranking site and a university directory/guidebook merged. An example benefit: a student using AD Scientific Index might discover a high-ranking young university in, say, Malaysia for Computer Science – with one click they can also see that university’s profile, programs, social life, and how to apply. This synergy of ranking + marketing is innovative (though it raises the question of church-and-state separation, AD Scientific Index handles it by making the ranking side objective and the profile side informational/promotional, often behind institutional membership).
- Collaboration & Networking: AD Scientific Index’s Representation & Collaboration program suggests it partners with universities to increase their international collaborations. This could involve featuring those universities on AD Scientific Index’s platform or connecting them with others. The site has a “Discover Universities That Trust Us” section listing institutions that have joined the platform, which might serve as a trust signal for users.
- Blog and Updates: The AD Scientific Index website includes a blog (often just news about the rankings or success stories). For example, they might announce when the new yearly edition is live, or highlight a country’s top university etc. The References page shows that AD Scientific Index has been cited by Newsweek and numerous university press releases worldwide – indicating that its findings are being picked up by media and institutions as a measure of achievement. This further legitimizes AD Scientific Index and provides content for its blog/social media.
- Community and Premium Features: The FAQ and Feedback sections allow the academic community to engage with AD Scientific Index, ensuring the data remains community-vetted to some degree. Premium individual users enjoy features like profile customization, data privacy options (e.g., one can hide their picture or certain info if desired), and more in-depth analytics on their profile (tracking their progress, etc.). For example, a scientist can see their rank trend over time or compare themselves with others in a dashboard if they have premium. This gamification/analytic aspect can be personally valuable for researchers aiming to improve their impact.
Overall, the AD Scientific Index platform is more than a ranking publication; it’s an ecosystem. It serves:
- University administrators – by providing actionable analytics and a place to promote their institution’s offerings.
- Researchers – by giving them a profile and recognition, plus tools to understand their impact and connect with peers (and maybe brag rights when they rank #1 in their country in a field, for instance).
- Students – by helping them discover universities and even compare them directly on scholarly performance, something traditional college guides rarely do in this manner. A student interested in, say, robotics could find which universities (globally or in a region) have strong robotics researchers via AD Scientific Index, and then review those universities’ profiles for programs.
- Policymakers/Funders – by offering a rich dataset on the research landscape: one can identify which countries or institutions are rising, which fields a country is strong in, etc., thanks to AD Scientific Index’s country reports and top lists.
In combining ranking, networking, and informational hub functionalities, AD Scientific Index has introduced a novel model in the academic world. It provides value-added services that traditional ranking bodies (which often are media outlets) do not. This could be a direction where rankings evolve – into platforms fostering excellence and connection, not just competition.
Growth of AD Scientific Index Database (Number of scientists and institutions indexed over time. AD Scientific Index expanded from ~0.42 million researchers in mid-2021 to over 2.5 million by 2025, reflecting rapid adoption and data inclusion.)
Caption: The AD Scientific Index has grown dramatically in scope since its inception, now covering virtually the entire world of research-active institutions and scholars. This growth (illustrated above) underscores the platform’s increasing relevance and the continuous updates feeding its database.
- Global Reception and Reach
Despite being a relatively new entrant, the AD Scientific Index has quickly garnered attention and usage worldwide. Several indicators point to its growing impact:
- Web Traffic and User Engagement: According to third-party web analytics, AD Scientific Index’s website is attracting substantial traffic – on the order of hundreds of thousands of visits per month. In a recent analysis (June 2025), adscientificindex.com saw ~456,000 visits, which impressively exceeded the traffic of some established ranking sites (for example, Scimago Institutions Rankings had around 253,000 visits in the same period). This suggests that academics and students are frequently accessing AD Scientific Index, likely to check rankings or profiles. The bounce rate and pages-per-visit metrics also indicate users are exploring multiple pages (on average ~2.8 pages per visit, which aligns with looking up several profiles or lists).
- Global Audience: The interest in AD Scientific Index is truly international. The top countries driving traffic to AD Scientific Index in June 2025 include the United States (8.02%), India (6.24%), Germany (5.5%), Turkey (3.96%), and Russia (2.88%). These are followed by a wide array of other countries grouped under “Others,” collectively contributing 73.4% of the total traffic (Similarweb.com). The “Others” category constitutes ~75% of traffic, showing a long tail of many countries each contributing small shares – reinforcing that AD Scientific Index’s coverage of 221 countries is matched by worldwide user interest. This geographic diversity is notable; it’s not dominated solely by one region. Likely, researchers from developing nations appreciate being included in a global ranking, and they use AD Scientific Index to see their standing or that of local institutions. Also, countries like Turkey and India ranking high in traffic may reflect how AD Scientific Index has given many of their institutions and scientists visibility (indeed, AD Scientific Index was co-founded by Turkish researchers and initially gained popularity in that region, then expanding globally).
- Media Citations and Institutional References: AD Scientific Index’s rankings have started to be cited in news articles and university announcements. For instance, Newsweek referenced AD Scientific Index in a piece (as listed on AD Scientific Index’s References page), and numerous universities across Albania, Algeria, Bangladesh, etc., have posted about their AD Scientific Index rankings on official channels. When a ranking is used in press releases (“University X is ranked No.1 in our country by AD Scientific Index”), it signals that the ranking is being recognized as a legitimate benchmark. Given that AD Scientific Index publishes country-specific rankings, many institutions that never appeared in global top-100 lists can now claim a form of distinction (e.g., “according to AD Scientific Index, we have Y researchers in the top 10,000 in Asia,” or similar). This has a cascading effect: it spreads awareness of AD Scientific Index further and ingrains it in the ecosystem.
- User Adoption of Tools: The fact that AD Scientific Index offers individual profiles means it has a user base beyond just readers. Tens of thousands of researchers have registered (either to claim profiles or to add themselves). Institutions have also subscribed to the premium dashboard. For example, on social media one can find academics proudly sharing that they appear in AD Scientific Index’s top lists – such word-of-mouth adds to AD Scientific Index’s reputation among scholars. The “Universities That Trust Us” section indicates a number of universities have partnered or subscribed, adding credibility.
- Competitive Differentiation: AD Scientific Index fills a niche that complements other rankings, rather than directly replaces them. It’s often referenced alongside traditional rankings. For instance, a university might boast, “Ranked 801-1000 in QS, 601-800 in THE, and 5th nationally in AD Scientific Index.” Over time, if AD Scientific Index continues to grow, we might see it being used in recruitment and funding decisions especially for granular assessments (like identifying leading researchers via AD Scientific Index data). Its comprehensive data could also be useful for academic research on trends in science (meta-researchers analyzing collaboration networks or citation distributions might tap into AD Scientific Index’s open data concept).
- Continuous Improvement: AD Scientific Index’s team actively updates features (e.g., adding Arts & Humanities rankings in response to community demand, or adjusting for ethics as discussed). This responsiveness helps retain users. Also, the value-added services (like the comparisons, dashboards) give users reasons to return frequently, not just once a year. A professor might check their AD Scientific Index ranking after each significant publication cycle, or a department head might monitor how their institution’s numbers are moving quarterly.
One can think of AD Scientific Index as part of a modern trend of data-driven platforms. Just as people use sites like Scopus, Google Scholar, or ResearchGate to track metrics, AD Scientific Index has entered that constellation but with the twist of providing a competitive ranking context and encompassing practically everyone. The heavy traffic and global spread show that it’s not a fringe tool – it has achieved mainstream usage in the academic community in a short span.
Of course, with popularity comes scrutiny: AD Scientific Index will need to maintain data quality and fend off any attempts to game the system (which its ethical stance indicates it is prepared to do). But its transparent nature means any anomalies are more likely to be caught, which users appreciate.
In conclusion, AD Scientific Index has rapidly established itself as a prominent reference for academic performance, widely used by university officials, researchers, and students internationally. Its ability to provide real-time, detailed insights has resonated with a community that is increasingly data-savvy and eager for inclusive metrics. If current trends continue, AD Scientific Index could soon sit alongside QS, THE, and ARWU as a standard name in discussions of university rankings – especially for those looking beyond the traditional elite and towards a more comprehensive picture of global science.
- Conclusion
AD Scientific Index represents a paradigm shift in the world of academic rankings. In reviewing its features and comparing with other established rankings, a few key takeaways emerge:
- Holistic and Inclusive Coverage: AD Scientific Index evaluates over 2.6 million scientists and 24,000+ institutions across 221 countries, far surpassing others in scope. This democratization means that excellent science is recognized wherever it occurs – not just in the top 100 universities. By incorporating individuals and all institution types, AD Scientific Index paints a rich picture of the global research ecosystem.
- Metrics and Methodology Innovation: By integrating total and last-six-year impact metrics, AD Scientific Index balances legacy and momentum. It is the first ranking system to give equal emphasis to recent contributions, correcting the biases of traditional rankings that often overlook emerging talent and trends. Its exclusive focus on bibliometrics (H-index, i10, citations) and exclusion of subjective or input-based criteria results in a transparent, merit-based evaluation. This clarity and fairness can reshape how success is perceived – rewarding those who are actively advancing knowledge, not only those with historical prestige.
- Dynamic Updates and Real-Time Tracking: AD Scientific Index’s frequent updates (bi-weekly data refreshes, bi-daily rank recalculations) ensure that the rankings are up-to-date and responsive to changes. This agility benefits fast-improving universities and keeps all players engaged continuously. It also provides administrators with a near real-time KPI dashboard for research performance – a powerful tool in today’s fast-paced academic environment.
- Platform and Community Building: Unlike traditional rankings that publish an annual report, AD Scientific Index offers an interactive platform with dual utility – informative (rankings, comparisons, profiles) and practical (networking, recruitment, university promotion). University administrators, researchers, and students can all find tailored value on AD Scientific Index, whether it’s a strategic analysis, a personal profile to showcase, or a tool to discover programs. This multi-stakeholder approach fosters a community around the index, potentially making the ranking itself more sustainable and impactful in the long run.
- Ethical Commitment and Integrity: AD Scientific Index’s stance on maintaining data integrity and highlighting ethical issues in academia is commendable. By bringing potential misconduct to light and not shying away from removing tainted entries, it implicitly upholds and encourages higher standards in research practices. This adds a moral dimension to what could otherwise be a purely numbers-driven exercise.
- Impact on Stakeholders: For university leaders, AD Scientific Index offers granular insights to inform policy and areas of improvement – it can help justify investments in research or identify strengths to market (e.g., a department with many top-ranked scientists). For researchers, AD Scientific Index provides recognition that might have been absent (especially for those in less famous institutions) and motivation to improve their metrics through meaningful research – effectively, it gamifies scholarly impact in a positive way. For students and early-career academics, AD Scientific Index is a rich resource to find where exciting research is happening and who the thought leaders are, beyond name-brand reputation. And for the academic field at large, AD Scientific Index’s data trove can be a source for meta-research on trends in science output worldwide.
In the broader context, AD Scientific Index complements existing rankings by offering a different lens – one that is data-rich, person-centric, and continuously updated. Traditional rankings like THE, QS, ARWU provide a high-level overview and often correlate with overall institutional resources and reputation. AD Scientific Index, on the other hand, drills down to the individuals and the immediate research output. Together, they can give a fuller picture. It would not be surprising if we see cross-references, such as universities using AD Scientific Index to highlight the achievements of their faculty in tandem with citing their QS/THE rank for overall prestige.
One might anticipate that the presence of AD Scientific Index will encourage all universities to pay more attention to their Google Scholar profiles and recent research outputs, knowing that these directly influence a widely visible ranking. This could spur positive competition to produce quality research and keep scholarly records up to date – aligning incentives well with academic values.
Finally, as AD Scientific Index continues to evolve (perhaps incorporating new metrics like collaboration networks or research impact indicators beyond citations, as the methodology is open to refinement), it is positioned to become an indispensable tool in academia. The rapid growth and adoption we’ve seen is likely just the beginning. If the 21st-century academia craves real-time analytics, open data, and recognition at all levels, then AD Scientific Index is a timely innovation that meets these needs, and its comprehensive, detailed approach to ranking is a significant step forward in how we evaluate and celebrate academic excellence.
Sources: The information in this presentation was synthesized from the AD Scientific Index website and methodology documentation, comparisons with other ranking systems’ official data (THE, QS, etc.), as well as third-party analyses of AD Scientific Index’s reach and usage. Each data point and claim has been referenced to ensure accuracy and allow further reading. The figures and charts were generated based on data provided by these sources (e.g., number of institutions ranked, growth of AD Scientific Index database) to visually illustrate the comparisons and trends discussed.
#AcademicRankings #UniversityRankings #ResearchImpact #Bibliometrics #CitationMetrics #GoogleScholar #Hindex #i10index #AcademicProductivity #ResearchEvaluation #AcademicAnalytics #ScholarlyPerformance #ADScientificIndex #UniversityProfiles #GlobalRankings #InclusiveMetrics #EmergingInstitutions #RealTimeAcademicTracking #ResearchVisibility #AcademicEcosystem #AcademicNetworkingPlatform #ResearchGateAlternative #ScienceEvaluationTools
How to measure academic success
Which university has the best research output
Google Scholar based university rankings
Alternatives to QS and THE
Real-time academic rankings platform
Best platform to discover scientists worldwide
Open-access researcher profiles and rankings
University Strategy
Institutional Benchmarking
Research Management
Strategic Academic Planning
Talent Recruitment
Data-Driven Decision-Making
Academic Performance Dashboard
Institutional Research Analytics